When we predict a value of something using Prophet we get not only the estimated value but also the lower and upper bound of the uncertainty interval. To make them more useful for us, we should dig a little bit into the details and see how Prophet produces them.
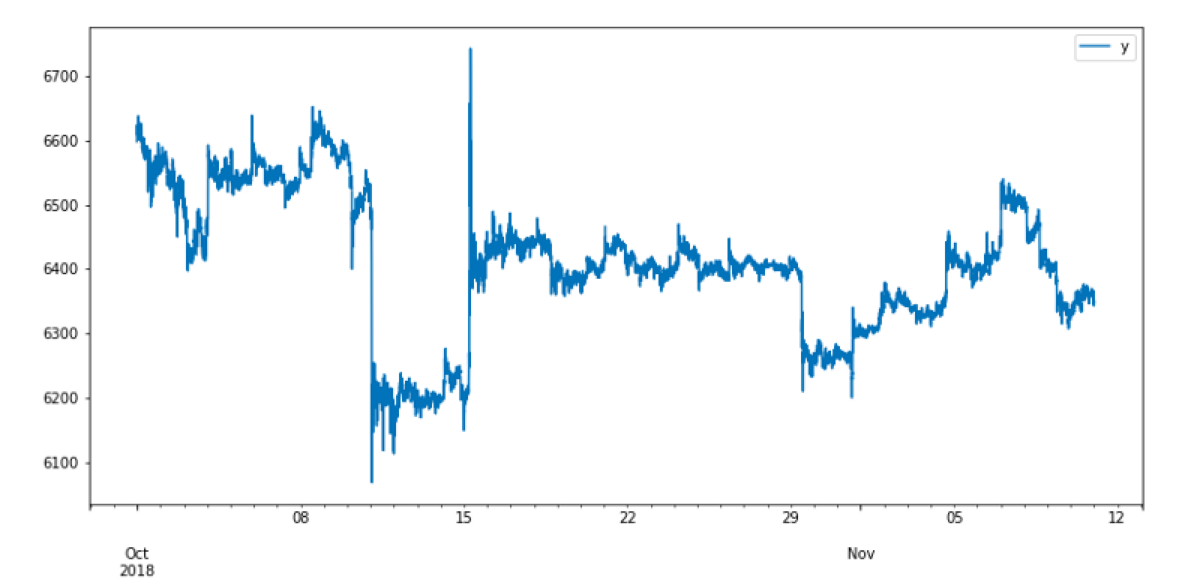
Let’s look at the examples. In all of them, I use the same dataset as the input. This dataset is a collection of Bitcoin prices between 2018.10.01 and 2018.11.11. It looks like this.
import pandas as pd
from fbprophet import Prophet
data = pd.read_csv('../input/bitstampUSD_1-min_data_2012-01-01_to_2018-11-11.csv')
data['date'] = pd.to_datetime(data['Timestamp'], unit="s")
input_data = data[["date", "Close"]]
input_data = input_data.rename(columns={"date": "ds", "Close": "y"})
subset = input_data[input_data["ds"] >= "2018-10-01"]
subset.plot(x = "ds", y = "y")
In all cases, I am going to generate predictions of the Bitcoin price for the next 72 hours, so for this dataset for days between 2018.11.12 and 2018.11.14.
If we check the real Bitcoin prices on that days, we see that my predictions are very, very wrong. It is okay because this blog post is about tweaking uncertainty intervals, not about improving the accuracy of estimations ;)
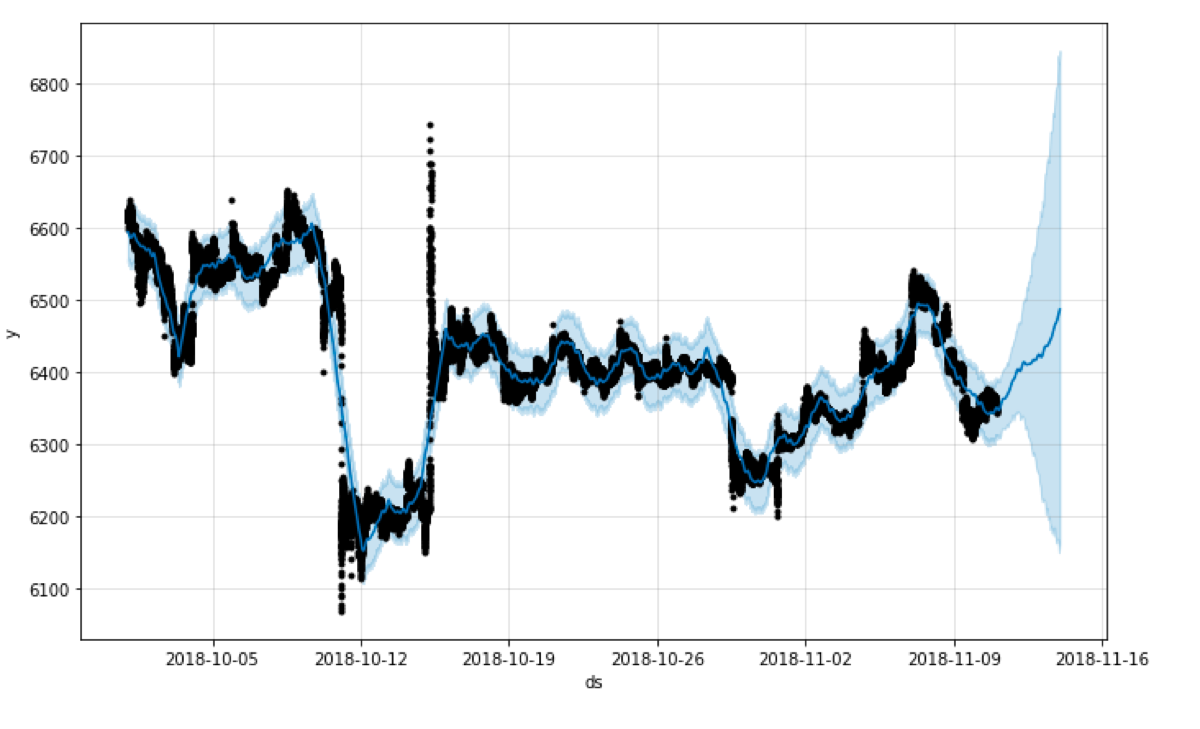
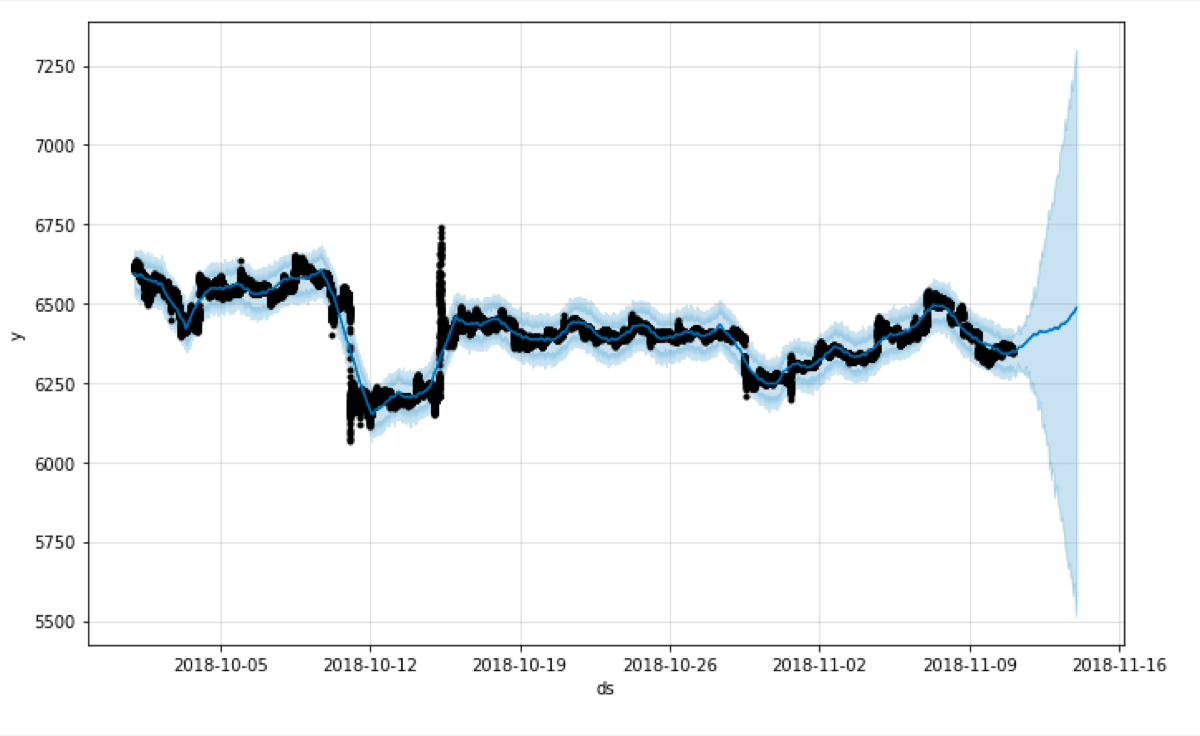
In the first example, I am going to generate predictions using the default parameters.
m = Prophet()
m.fit(subset)
future = m.make_future_dataframe(periods=72, freq="H")
forecast = m.predict(future)
fig1 = m.plot(forecast)
Prophet estimates the uncertainty intervals using Monte Carlo simulation. The “uncertainty_samples” parameter controls the simulation. It is the number of samples used to estimate the uncertainty interval (by default 1000).
We can reduce that number to speed up Prophet, but such a reduction gives us uncertainty which has a higher variance
Let’s see what happens when I reduce the number of samples from 1000 to 100. Look at the shape of the plotted interval.
m = Prophet(uncertainty_samples = 100)
m.fit(subset)
future = m.make_future_dataframe(periods=72, freq="H")
forecast = m.predict(future)
fig1 = m.plot(forecast)
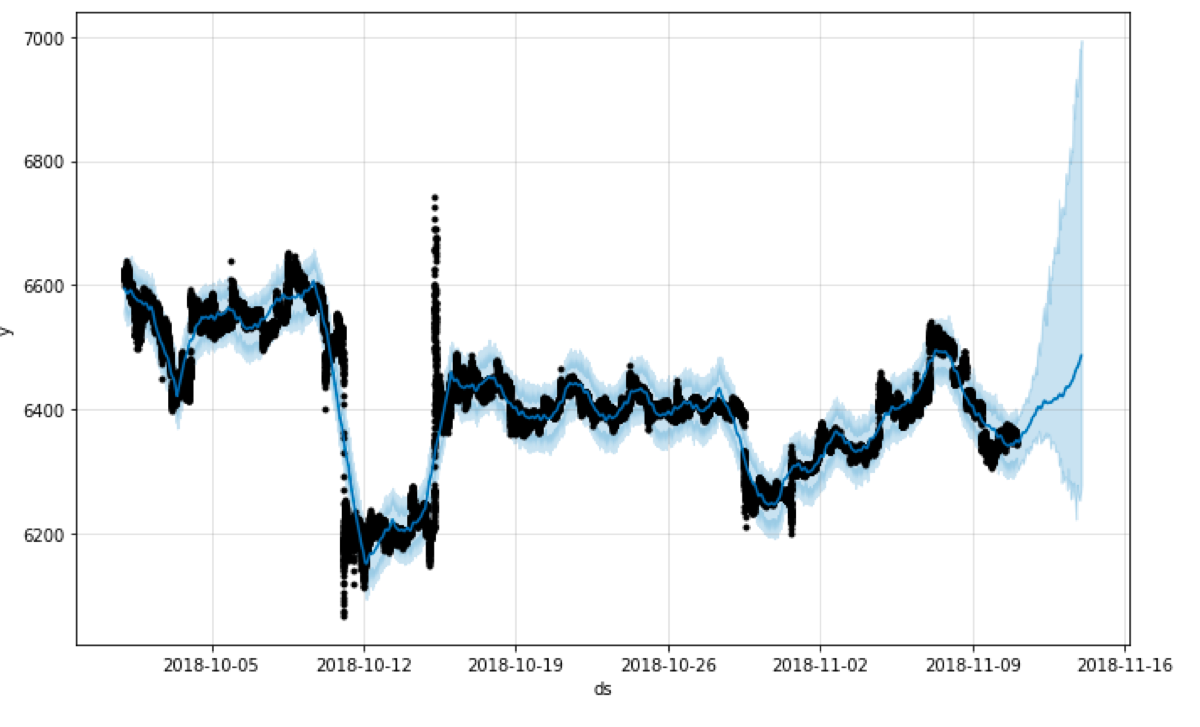
It is not as smooth as the one generated using 1000 samples and the variance is larger than in the previous example.
Due to the default settings, the uncertainty interval covers 80% of the samples generated by the Monte Carlo simulation. For me, it was counterintuitive because I expected 95% uncertainty interval.
We can set the width of the interval using the “interval_width” parameter. If we set it to 0.95, the generated uncertainty interval is going to be enormous ;)
m = Prophet(uncertainty_samples = 100, interval_width = 0.95)
m.fit(subset)
future = m.make_future_dataframe(periods=72, freq="H")
forecast = m.predict(future)
fig1 = m.plot(forecast)
What else does affect the uncertainty interval?
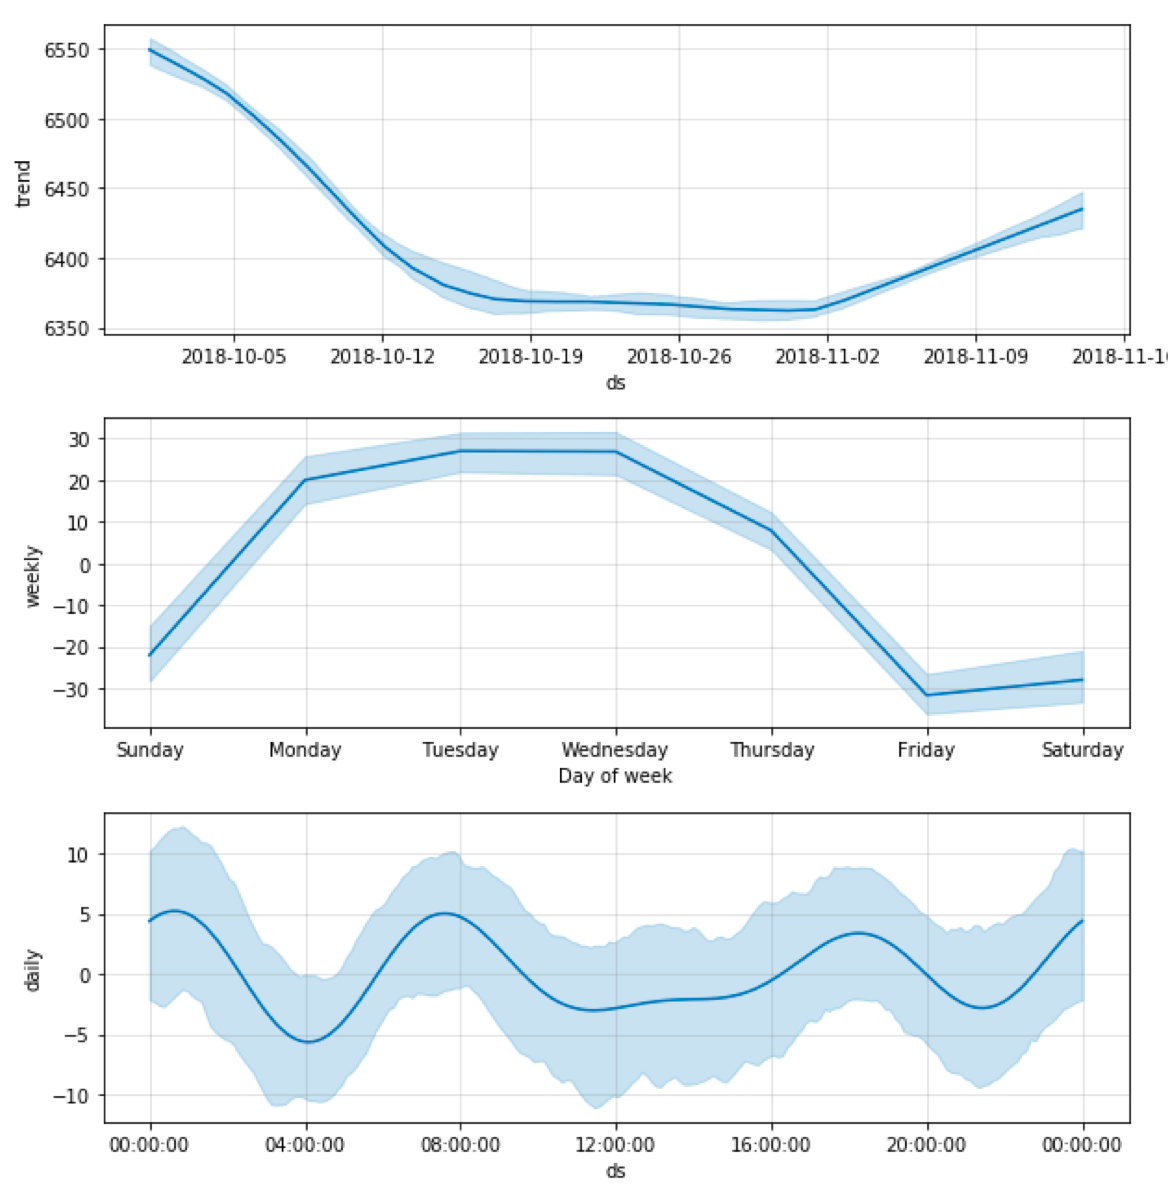
Seasonality. By default, the uncertainty interval of the calculated seasonality is not taken into account, but Prophet calculates it when we set the “mcmc_samples” parameter. We see the difference in both the forecast plot and the plot of the components.
m = Prophet(uncertainty_samples = 100, mcmc_samples=100)
m.fit(subset)
future = m.make_future_dataframe(periods=72, freq="H")
forecast = m.predict(future)
fig1 = m.plot(forecast)
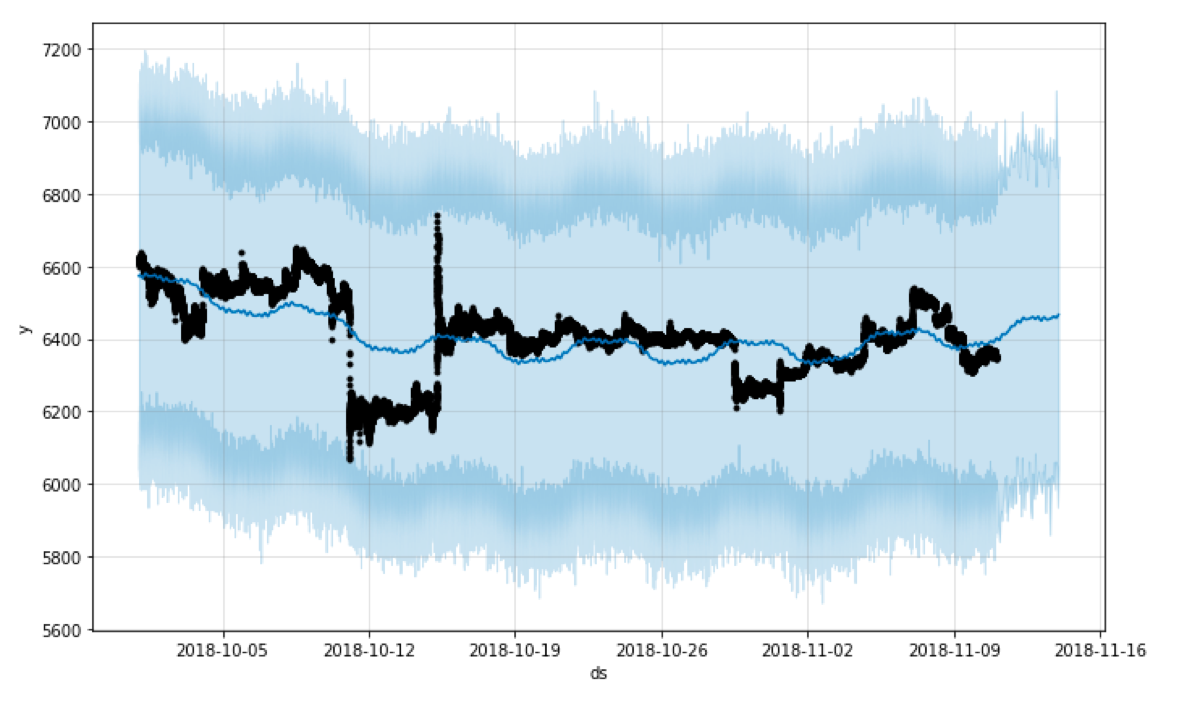
fig2 = m.plot_components(forecast)