
In this example, we are going to use the Titanic dataset. I remove the rows containing missing values because dealing with them is not the topic of this blog post.
Table of Contents
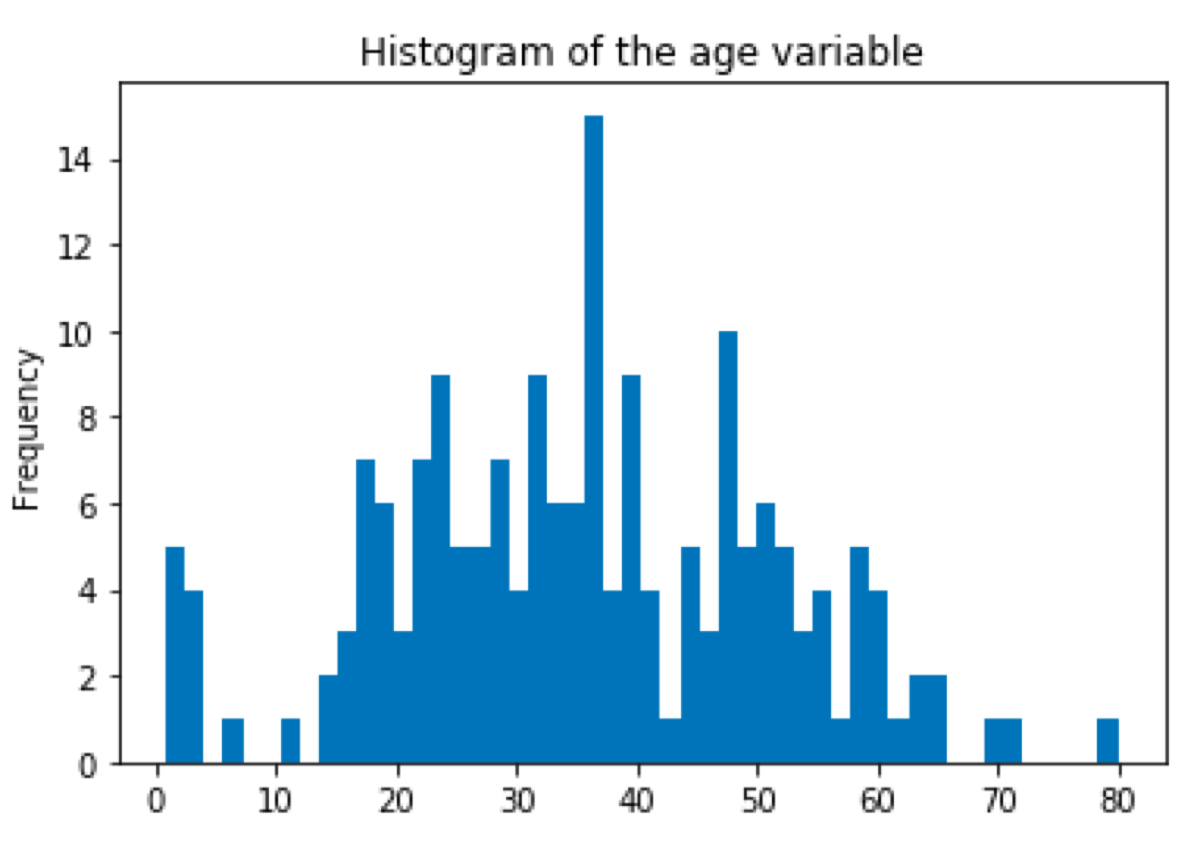
First, we are going to find the outliers in the age column. To decide which method of finding outliers we should use, we must plot the histogram of the variable and look at its distribution.
import seaborn as sns
import pandas as pd
titanic = sns.load_dataset('titanic')
titanic = titanic.copy()
titanic = titanic.dropna()
titanic['age'].plot.hist(
  bins = 50,
  title = "Histogram of the age variable"
)
Z-score
It looks a little bit like Gaussian distribution so we will use z-score. Z-score is the difference between the value and the sample mean expressed as the number of standard deviations. To check what percentage of values covers a range of z-score values we should take a look at a (z-table)[http://www.z-table.com/].
from scipy.stats import zscore
titanic["age_zscore"] = zscore(titanic["age"])
titanic["is_outlier"] = titanic["age_zscore"].apply(
  lambda x: x <= -2.5 or x >= 2.5
)
titanic[titanic["is_outlier"]]

DBSCAN — Density-Based Spatial Clustering of Applications with Noise
Another way to find the outliers is DBSCAN which uses clustering. In this method, we calculate the distance between points (the Euclidean distance or some other distance) and look for points which are far away from others.
As an example, we will select the age and fare from the Titanic dataset and look for the outliers in the data frame.
First, we are going to plot the data frame and check if there are some values which may be considered to be outliers.
ageAndFare = titanic[["age", "fare"]]
ageAndFare.plot.scatter(x = "age", y = "fare")
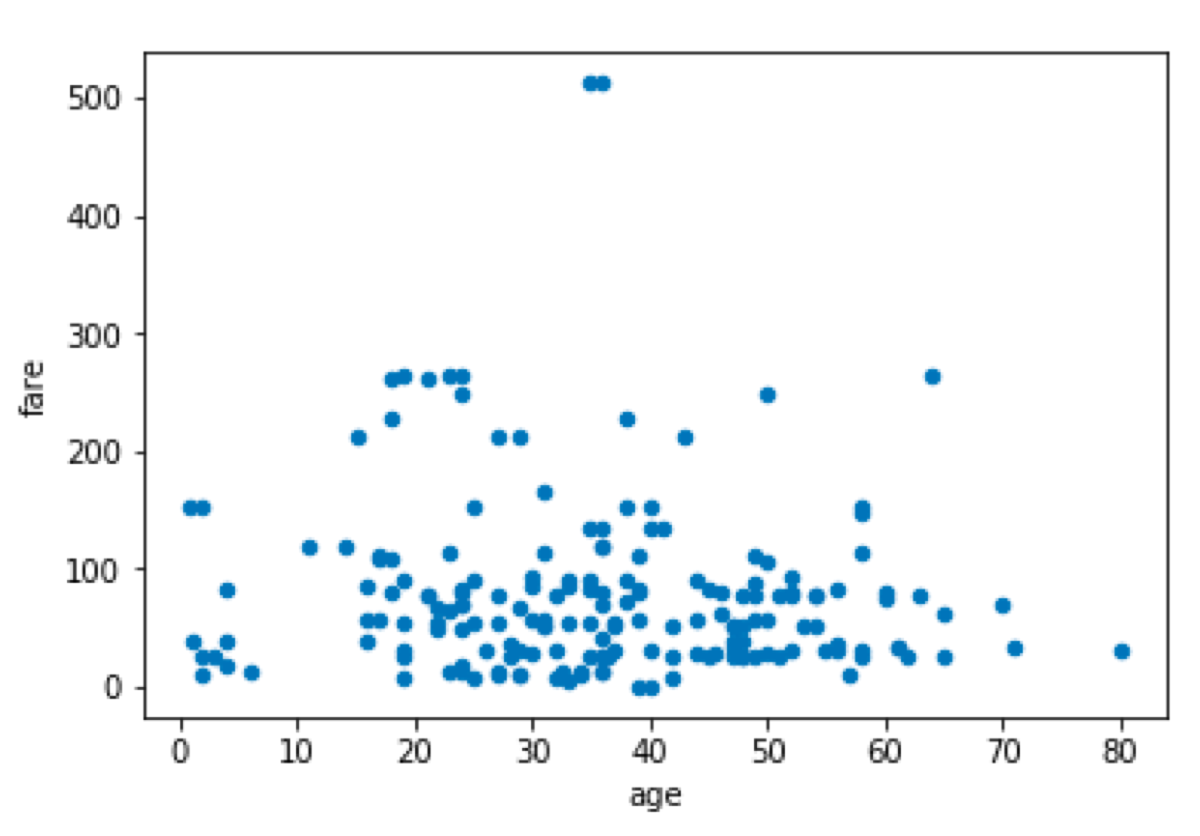
We see two points with a large value of the “fare” attribute.
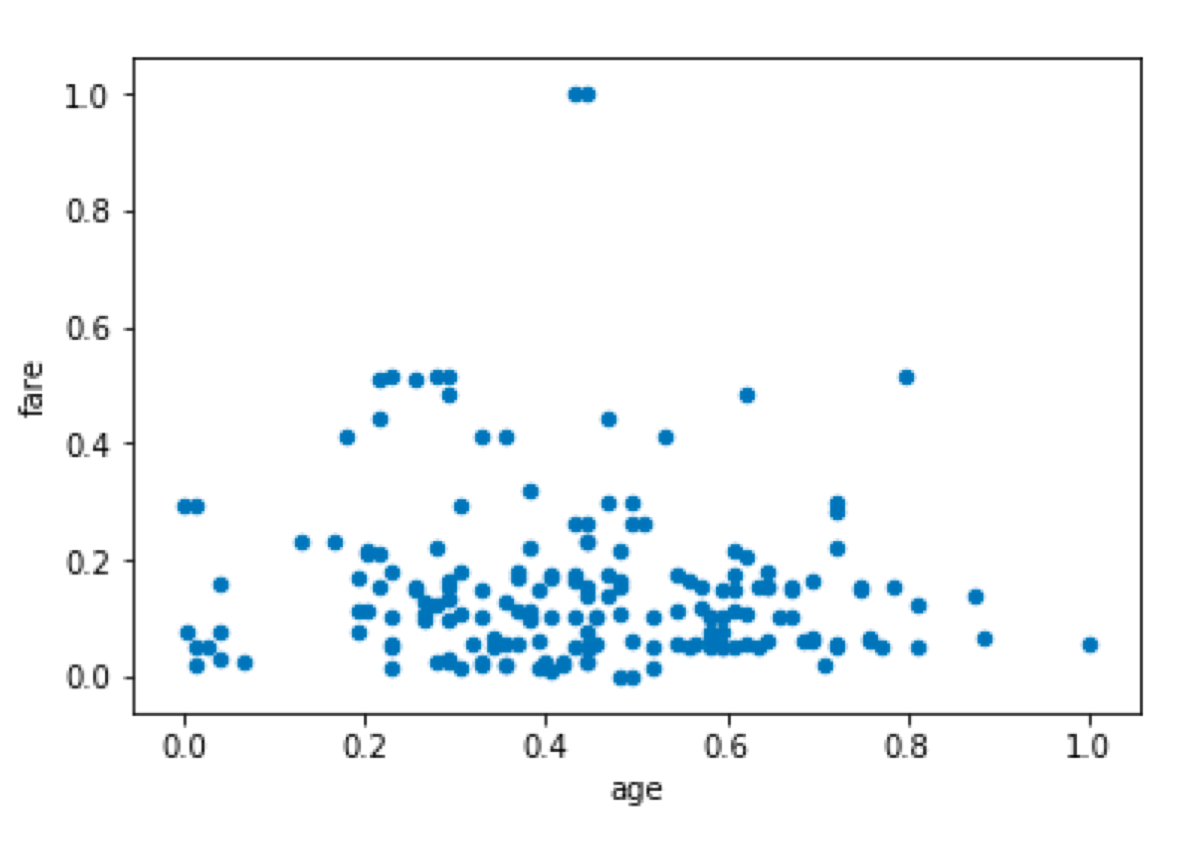
We also see that both variables have different scales. Because of that, the distance would be dominated by the fare variable. We don’t want that so we must normalize variables.
from sklearn.preprocessing import MinMaxScaler
scaler = MinMaxScaler()
ageAndFare = scaler.fit_transform(ageAndFare)
ageAndFare = pd.DataFrame(ageAndFare, columns = ["age", "fare"])
ageAndFare.plot.scatter(x = "age", y = "fare")
DBSCAN is going to assign points to clusters and return the labels of clusters. If it cannot assign the value to any cluster (because it is an outlier), it returns -1. In this example, it may also return a cluster which contains only two points, but for the sake of demonstration I want -1 so I set the minimal number of samples in a cluster to 3.
from sklearn.cluster import DBSCAN
outlier_detection = DBSCAN(
  eps = 0.5,
  metric="euclidean",
  min_samples = 3,
  n_jobs = -1)
clusters = outlier_detection.fit_predict(ageAndFare)

clusters
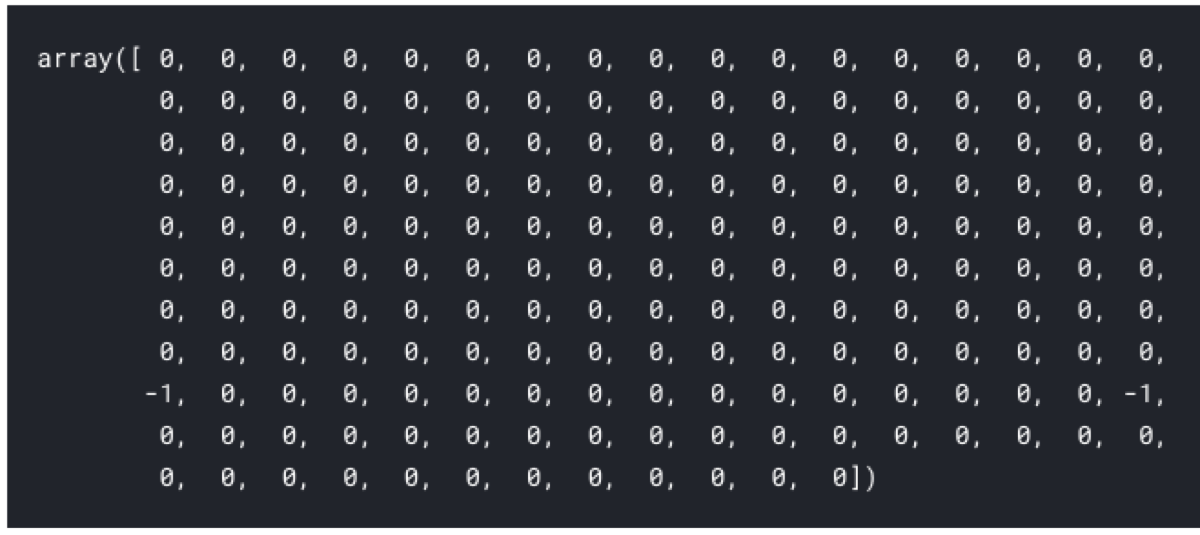
As expected we have found two outliers. Now we should verify whether the points marked as outliers are the expected ones. We can either:
-
merge the output to the data frame and print the output, or
-
we can plot the dataset and use the cluster identifier to color the points.
from matplotlib import cm
cmap = cm.get_cmap('Accent')
ageAndFare.plot.scatter(
  x = "age",
  y = "fare",
  c = clusters,
  cmap = cmap,
  colorbar = False
)
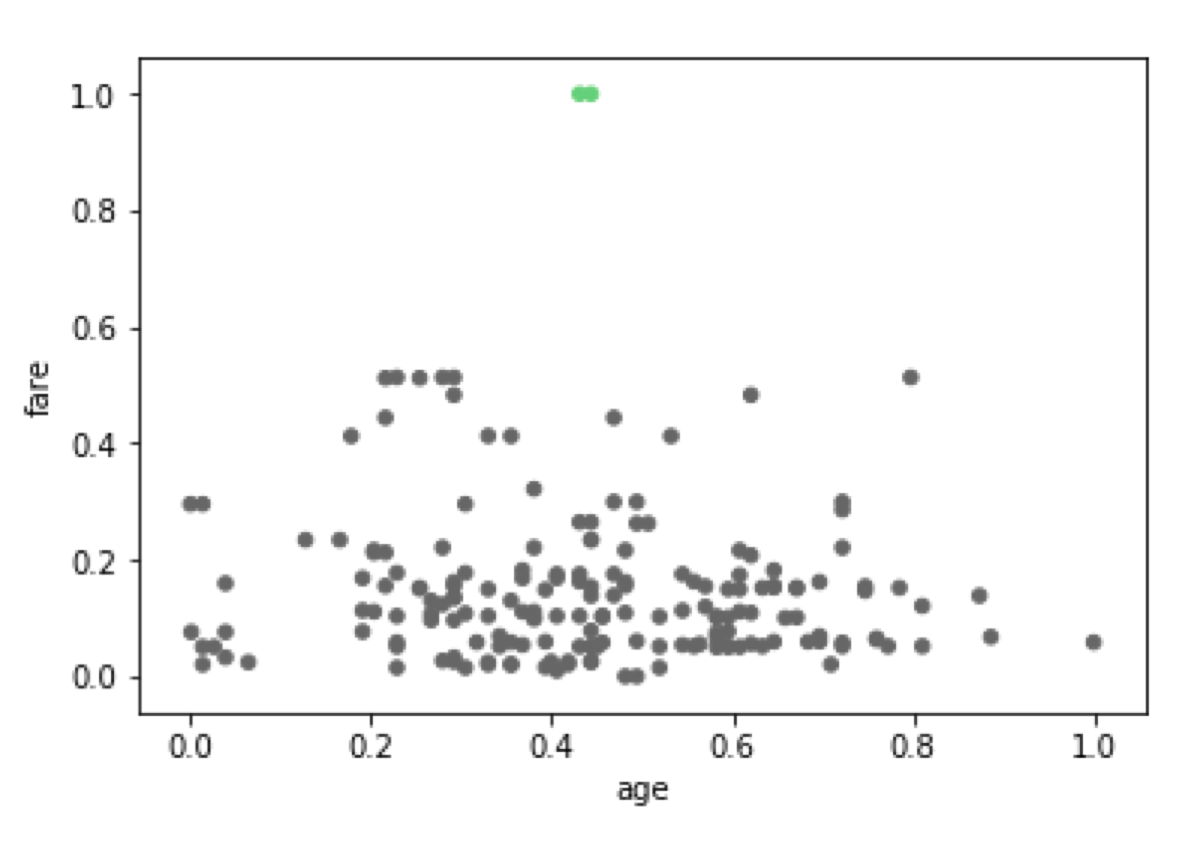
Done! ;)