
In my opinion, AUC is a metric that is both easy to use and easy to misuse. Do you want to know why? Keep reading ;)
Table of Contents
To plot the ROC, we need to calculate the True Positive Rate and the False Positive Rate of a classifier. In Scikit-learn we can use the roc_curve function.
from sklearn.metrics import roc_curve

y_true = ['dog', 'dog', 'cat', 'cat']
probability_of_cat = [0.1, 0.4, 0.35, 0.8]
positive_label = 'cat'

fpr, tpr, thresholds = roc_curve(y_true, probability_of_cat, positive_label)
Plotting the chart
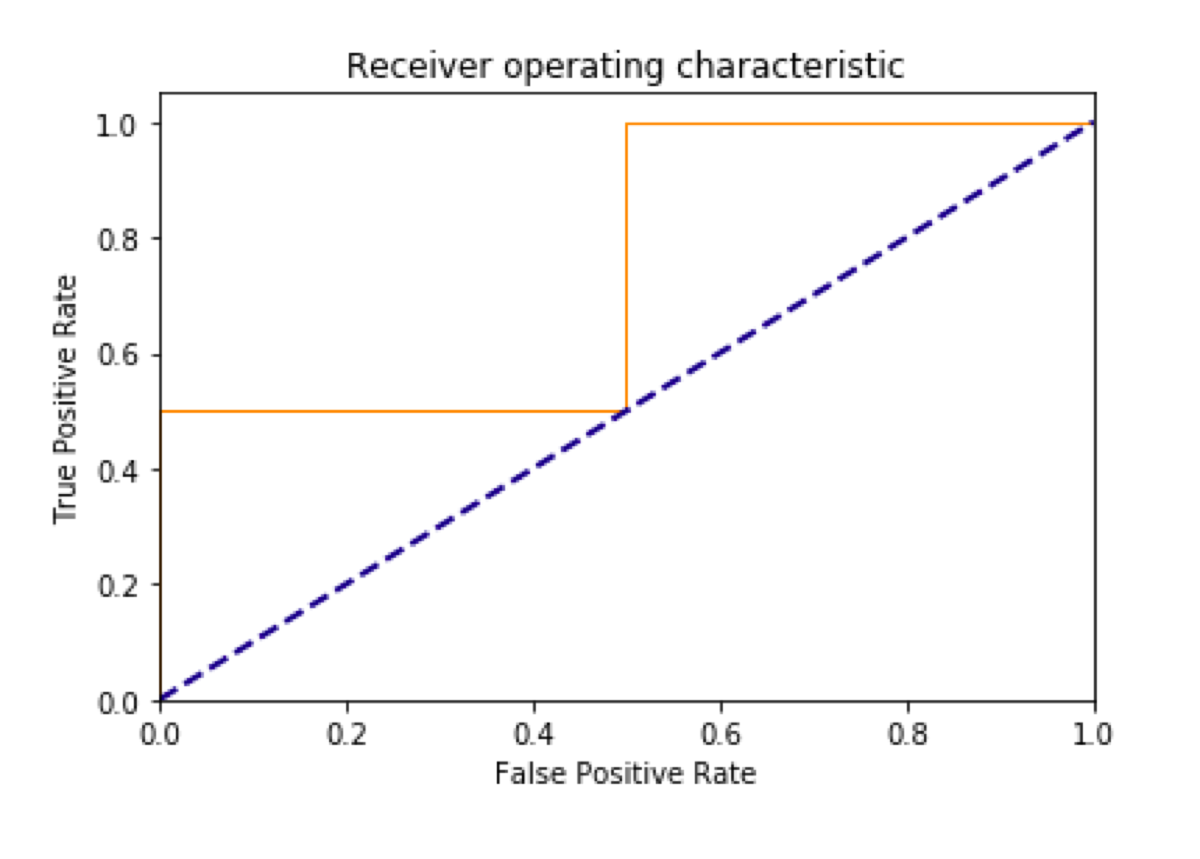
When we talk about ROC, everyone things of the plot. So let’s make the plot.
import matplotlib.pyplot as plt

plt.figure()
plt.plot(fpr, tpr, color='darkorange', lw = 1)
plt.plot([0, 1], [0, 1], color='navy', lw = 2, linestyle='--')
plt.xlim([0.0, 1.0])
plt.ylim([0.0, 1.05])
plt.xlabel('False Positive Rate')
plt.ylabel('True Positive Rate')
plt.title('Receiver operating characteristic')
plt.show()
AUC
Now, we can explain AUC. Look at the solid line. AUC stands for Area Under the Curve. That’s right. We must calculate the area under the solid line. Do you remember integral calculus? No? Me either. Fortunately, we can use a built-in Scikit-learn function.
Note that we need “True binary labels or binary label indicators.” so labels must be converted to 0s and 1s: 0 for the negative label and 1 for the positive label.
from sklearn.metrics import roc_auc_score
roc_auc_score([0, 0, 1, 1], probability_of_cat)
Interpretation
We may interpret the AUC as the percentage of correct predictions. That makes AUC so easy to use. It is trivial to explain when someone asks why one classifier is better than another. Every person who has ever looked at a weather forecast can understand that ;)
When it is a wrong metric
Unfortunately, it is also easy to misuse. For this metric, every kind of error is equally wrong. What if it is not the case?
What if we were making a classifier that for predicting whether a patient should go home or undergo an additional diagnosis. If we make a mistake and decide that a healthy person needs some other procedures, we will waste some money, the patient’s time and perhaps that person is going to be terrified of possible illness. That is annoying, but not a dangerous consequence of a mistake. On the other hand, if we decide that a sick person does not need any treatment, the patient’s health is in danger.
We have no way to parameterize the AUC and set the weight of some errors higher than others. AUC just does not care ;)